Newark NJ thermometer just hit 100° five days in a row – but it’s wrong
The Problem
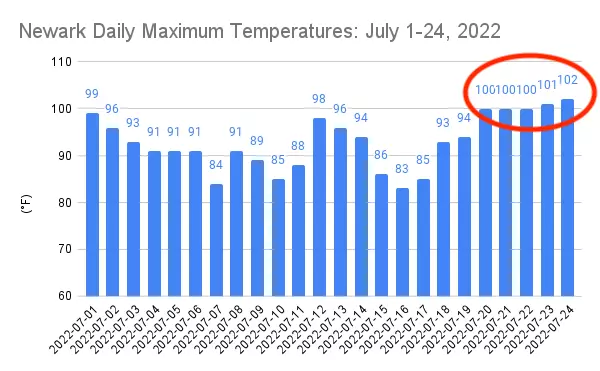
Wednesday, July 20, 2022... 100 degrees
Thursday, July 21, 2022... 100 degrees
Friday, July 22, 2022... 100 degrees
Saturday, July 23, 2022... 101 degrees
Sunday, July 24, 2022... 102 degrees
In the midst of a stretch of extreme heat and humidity, New Jersey just hit a milestone that has never occurred in recorded history (at least 91 years).
The Newark Liberty Intl AP weather station hit 100+ degrees five days in a row. The previous longest stretch there was four straight days, set in July 2010, July 1993, and August 1953. Not a pleasant record to break.
But there is a problem here. For many months, it has become clearer and clearer that the thermometer (technically a "thermistor") at Newark is wrong. It is reading several degrees too warm. And I can prove it.
About KEWR
The weather station at Newark Airport is part of the Automated Surface Observing System (ASOS), described as "a joint effort of the National Weather Service (NWS), the Federal Aviation Administration (FAA), and the Department of Defense (DOD)." There are more than 900 of these automated weather stations across the United States, primarily at airports (to aid in aviation). They are called "first-order" stations, generally known for high-quality observations.
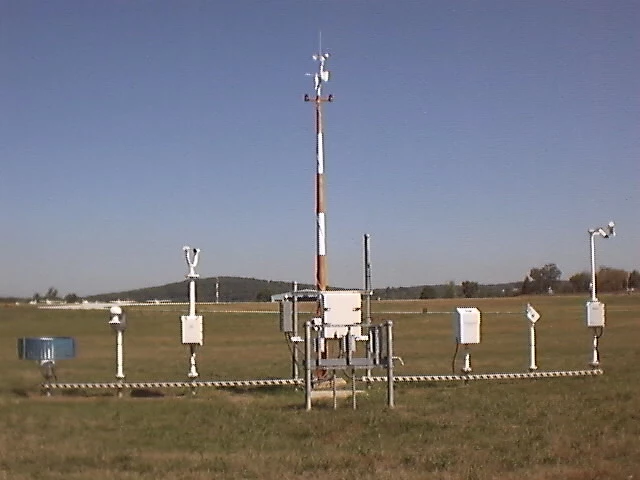
KEWR (also known as cooperative observing station 286026) can be found between the main 4/22 runaways of Newark Liberty International Airport and the southbound truck lanes of the NJ Turnpike.


Fun fact: The Newark weather station is technically in Elizabeth, Union County - not Newark, Essex County.
Newark tends to be one of the hottest weather stations in the state, especially during the sizzling summertime. Is it ideal to have a first-order weather station surrounded by active runways, jet blasts, Turnpike traffic, and the Newark Bay? Not necessarily — but it is important to capture the "urban heat island" effect of that concrete jungle.
We also like to use Newark Airport data because there has been a high-quality weather station nearby and reporting almost daily since 1931 - just a few years after Newark Municipal Airport opened (in 1928). Decades and decades of high-quality data is extremely useful for weather and climate research, etc.
Now let's get to the meat of the issue. How do I know something is wrong? Three reasons...
1.) Intuition from a Real Live Meteorologist
I literally stare at the weather every single day. It's my job. So when something is off, it is very noticeable.
In this case, I recognized both forecast models and my own estimates were grossly underestimating actual Newark temperatures on an almost-daily basis. ("Busting low" — I have since compensated for that trend in my northeastern New Jersey forecasts.)
Of course, that anecdotal evidence is not incredibly compelling or definitive. But, like the beginnings of any good research question, it was the spark to dig into the numbers and do some real analysis.
2.) Monthly Departures
We are lucky here in New Jersey to have a dense network of weather stations, with relatively long periods of record. (Appropriate for the most densely populated state in the country.) That allows for easy, meaningful comparisons between Newark and surrounding weather stations.
In this case, I settled on comparing monthly temperature "departure from normal" — how far off the actual average temperature for the month differed from the long-term, 30-year average (called a "normal"). This calculation is kind of the gold standard in this area of climatological detective work. (Although you could make the argument that if the normals are wrong, my math is wrong. Assumptions are part of the game here.)
I selected six stations in the region to compare to Newark's monthly mean maximum (high temperature. That included four ASOS stations at Trenton-Mercer Airport, Atlantic City International Airport, Central Park in New York City, and Philadelphia International Airport. I also used the long-established New Brunswick cooperative weather station at Rutgers Gardens. And for proximity, I also selected the coop station in Harrison, which is less than five miles north of Newark Airport.
The theory here is that all these weather stations in and around New Jersey should have a similar temperature trend, compared to normal. And they do:
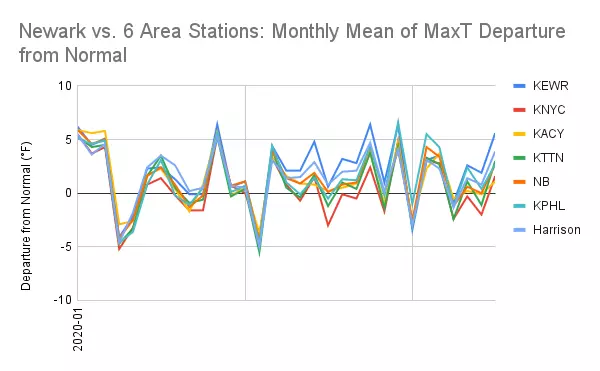
The x-axis runs from January 2020 through July 2022 (the first 23 days only). There's pretty good consistency. You can make out the fact that Newark (KEWR) is generally the hottest station of the group. But it doesn't stand out much.
But what if we average together the six comparison stations, so it's just two data series to compare?
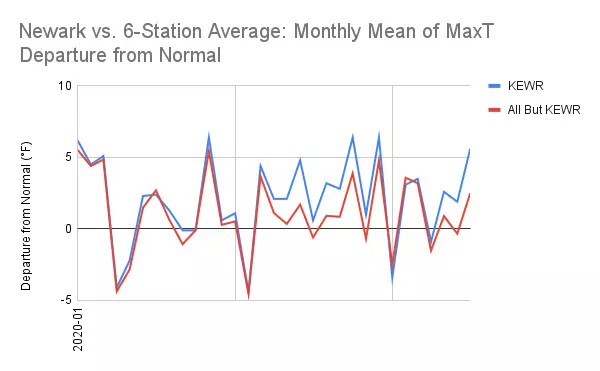
Since Spring 2021, Newark has clearly trended hotter than the other-stations average. Look at June 2021, which had more than a 3 degree difference between Newark (4.8 degrees above normal) and the others (1.7 degrees above). Or just last month, June 2022, in which the other stations ended up slightly below normal. But Newark's departure was more than 2 degrees higher.
(For the record, I also looked at average temperature and minimum/low temperature variables, but the outcome was not as conclusive.)
So this confirms the working theory that since approximately March 2021, in more months than not, Newark temperatures have been running 2 to 3 degrees warmer than reality.
3.) Daily Departures
We can also look at day-by-day temperatures to see if a trend develops, even though the analysis gets a little muddier.
In this case, I did a daily comparison between Newark and Harrison. Again, Harrison is less than five miles north of the airport. Still very much in the urban corridor, to capture the heat island effect. And the Harrison coop station has a dependable, knowledgeable observer with records going back to 1996.
This time, we're just looking at the raw difference between the daily high temperature at Newark and the daily high temperature at Harrison.
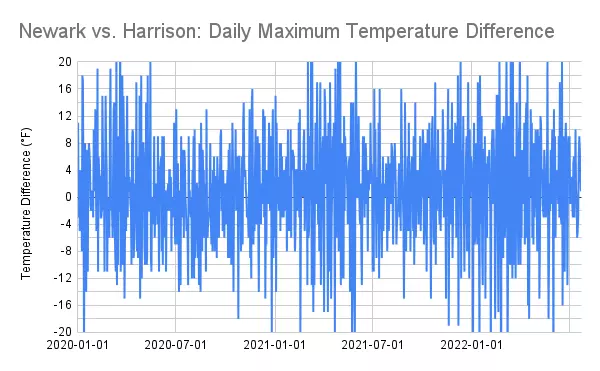
That is a busy graph. And some days have a huge variation in temperatures between the two stations. Some of the biggest disparities are likely due to time of observation differences (Newark's "day" runs Midnight to Midnight, while Harrison is 7 a.m. to 7 a.m.)
Let's add a linear trend line.
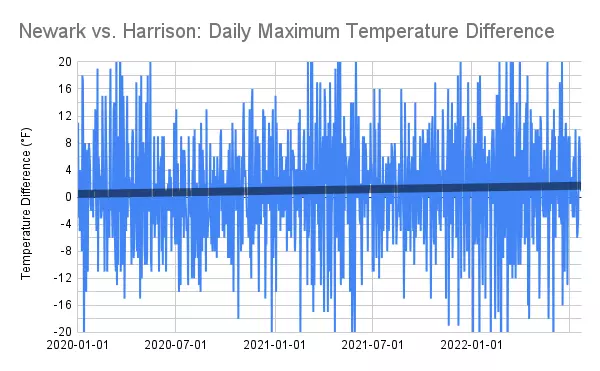
And let's zoom in on the y-axis to see that trend line better.
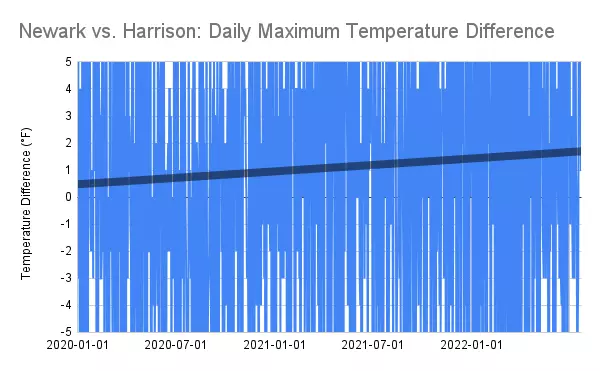
Interesting. Two and a half years ago, in January 2020, the data shows temperatures at Newark and Harrison were almost identical, on average. But those differences have slowly crept in the positive direction, to almost two degrees warmer at KEWR in July 2022.
It's not as definitive as the previous analysis. But still potentially significant.
Putting It All Together
So why would Newark's weather station trend noticeably warmer over the last 15 months? There are two possibilities. One, changes to the local landscape that warmer the microclimate around the Newark Airport station. Or two, which is more likely, the thermistor equipment has drifted a couple degrees warmer and needs to be calibrated or replaced.
Bottom line: Unfortunately, the temperature bias puts a big asterisk on our recent climate record in Newark. More specifically, our recent stretch of five consecutive 100-degree days is suspicious. While we're only talking about approximately a 2 to 3 degree drift, that would make all the difference in whether we hit 100 or not five days in a row.
In other words, instead of a five day temperature trend of 100-100-100-101-102, it may actually have been as cool as 97-97-97-98-99. If just one of those days didn't actually hit 100 degrees? No record-breaking streak of triple digit heat.
By the way, I feel like New Jersey climate change deniers will try to make this their "white whale." Some conspiracy theorists may claim that 1.) the data was manipulated deliberately to show a "false" warming trend, or 2.) the errors described here dramatically skew the statistics for our warming world. Nice try, but our observations of anthropogenic global warming are based on thousands of weather stations from around the world over the span of decades and centuries.
So what happens next? Probably nothing. As I mentioned, management of the ASOS network is shared among the National Weather Service, Federal Aviation Administration, and Department of Defense. I'm sure my meteorological colleagues in those organizations are aware of the issue at Newark. Unfortunately, I'm also concerned that government bureaucracy will get in the way of a resolution here.
One thing is for sure. I am going to be very careful about sharing climatological statistics from Newark Airport for the rest of the summer. We just can't trust the numbers right now.
Dan Zarrow is Chief Meteorologist for Townsquare Media New Jersey. His career stops at the Northeast Regional Climate Center and the NJ State Climate Office really come in handy sometimes. Follow Dan on Facebook or Twitter for your latest weather forecast updates.
LOOK: The most extreme temperatures in the history of every state
Gallery Credit: Anuradha Varanasi
Counting down New Jersey's top 15 weather stories of 2021
Gallery Credit: Dan Zarrow
More From 94.5 PST